Data
Whenever an infectious disease poses the risk of spreading into a global pandemic, air transportation plays a key role. Modern air traffic connects every corner of our globe. In doing so, it also enables regionally confined outbreaks of infectious diseases to “jump” across country borders at an unprecedented rate.
Therefore, the core of the computational model is the worldwide air transporation network (WAN). This network has 3893 nodes (airports) that are connected by 51476 directed links (flight routes). Each link is weighted by the traffic flux between nodes, i.e. the average number of passengers that travel each route per day.
The WAN has been analyzed in many publications and used in a variety of computational models for the spread of infectious diseases.
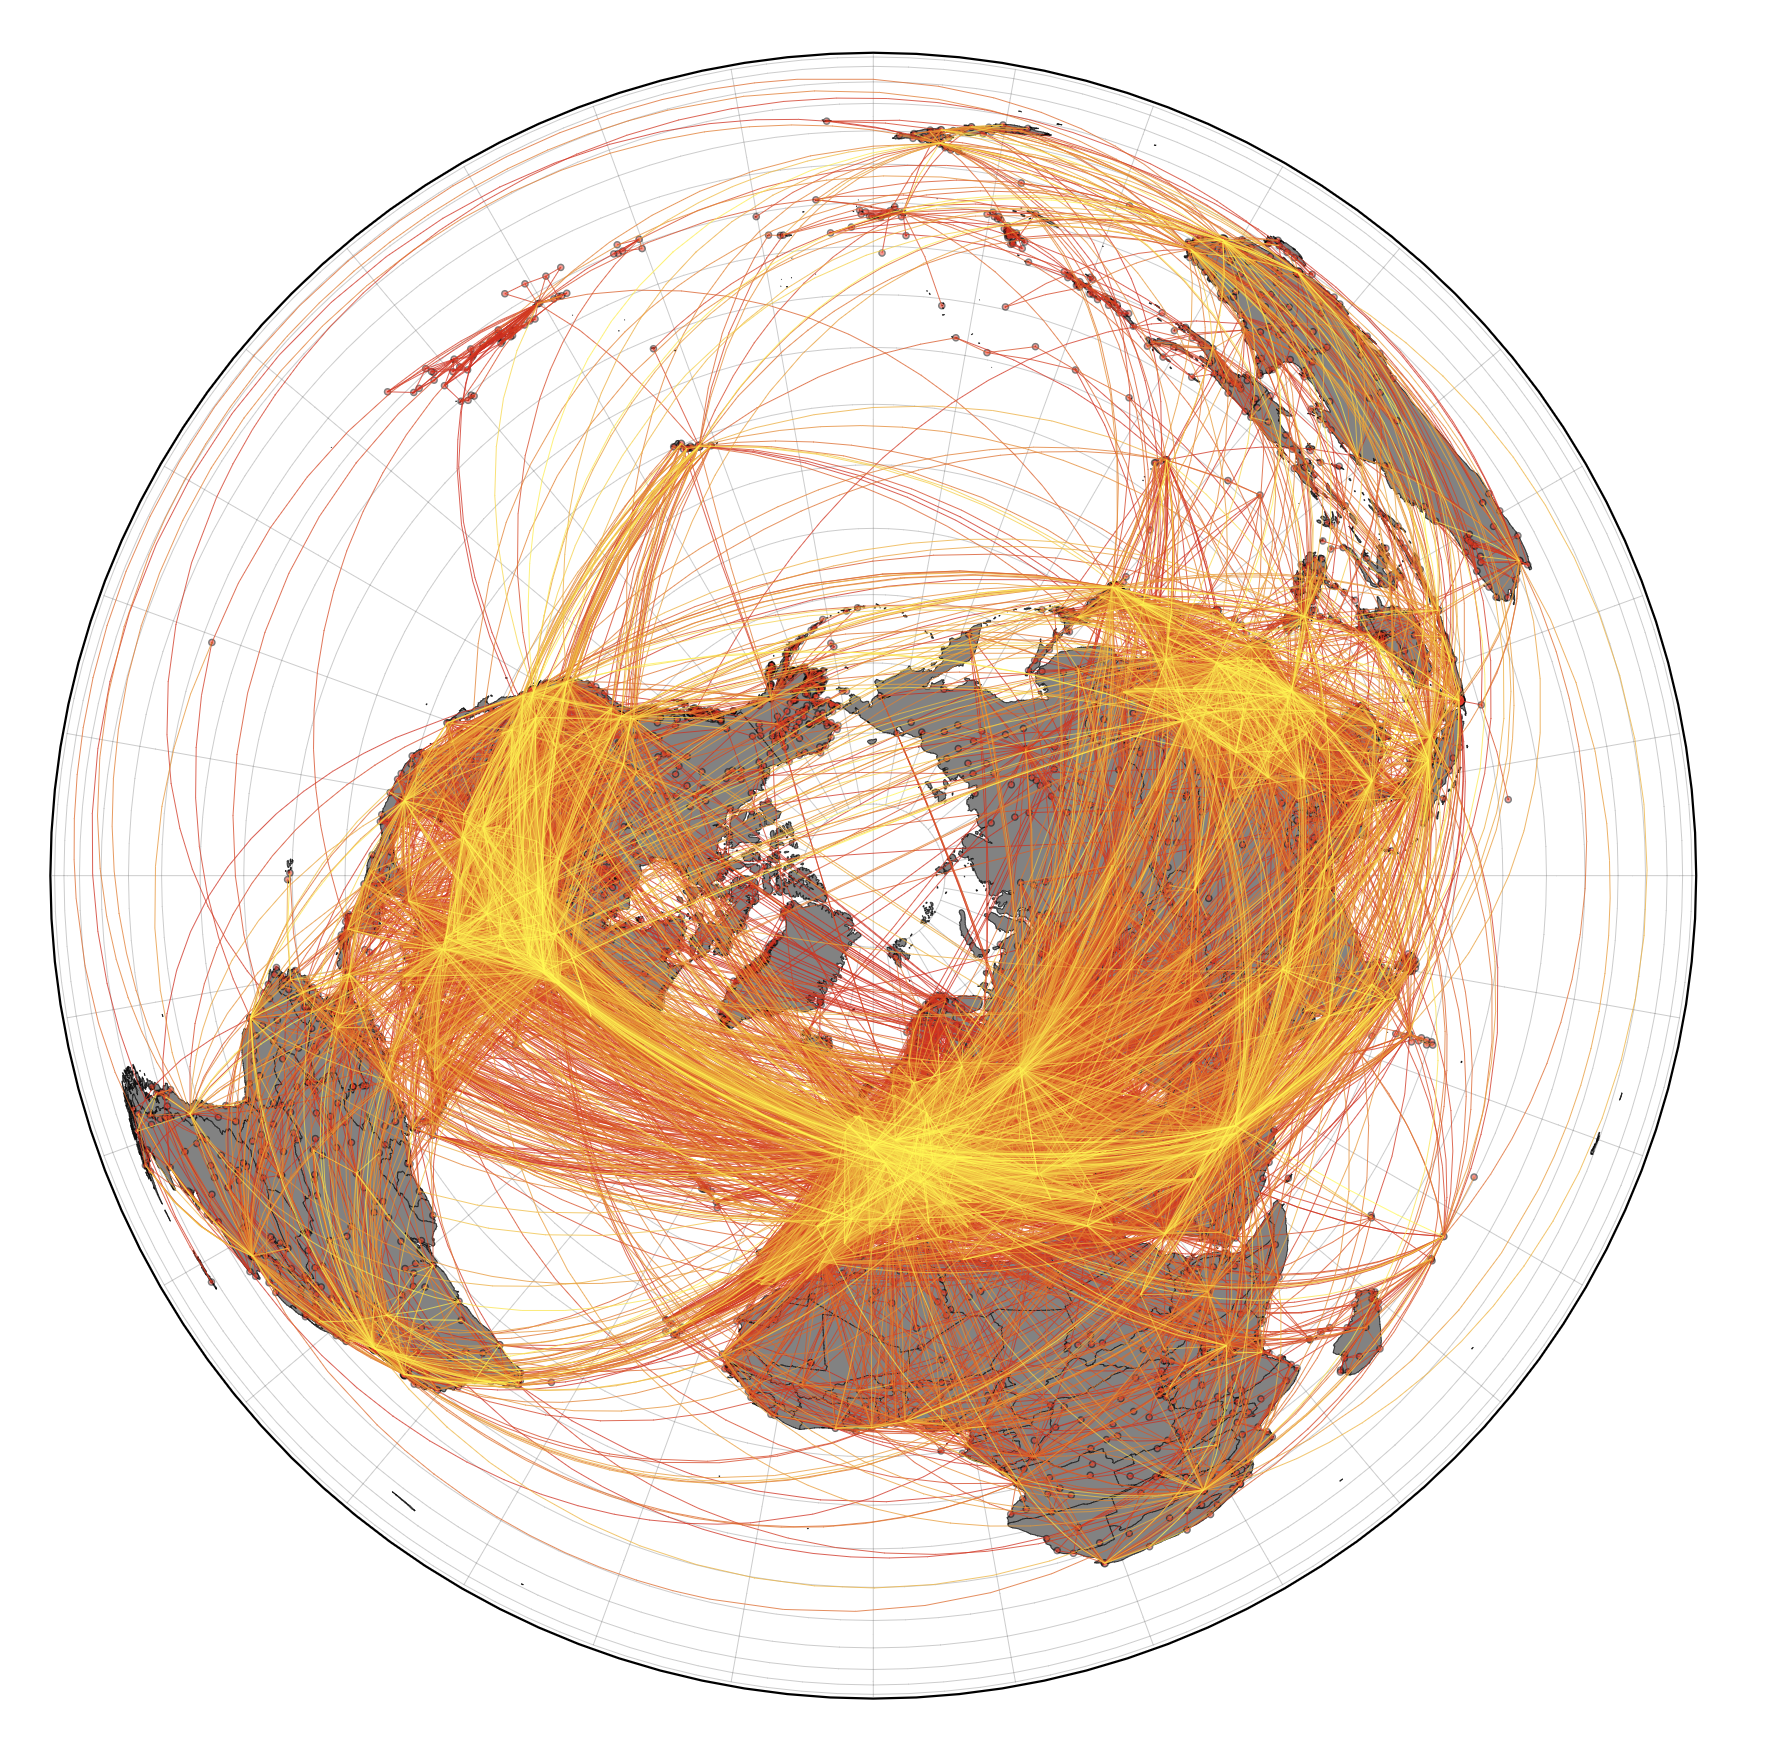
Worldwide air transportation network. This network of global mobility is the foundation of the computational model that predicts import risks, most probable spreading routes, and the importance of specific airports in the global dissemination of COVID-19.
Properties of the worldwide air transportation network
The WAN exhibits strong intrinsic structural heterogeneity – some airports are tiny, while others are huge international hubs. These distinctions can be observed by examining the wide-range of magnitudes of various properties of the WAN – a clear sign of network heterogeneity, summarized below.
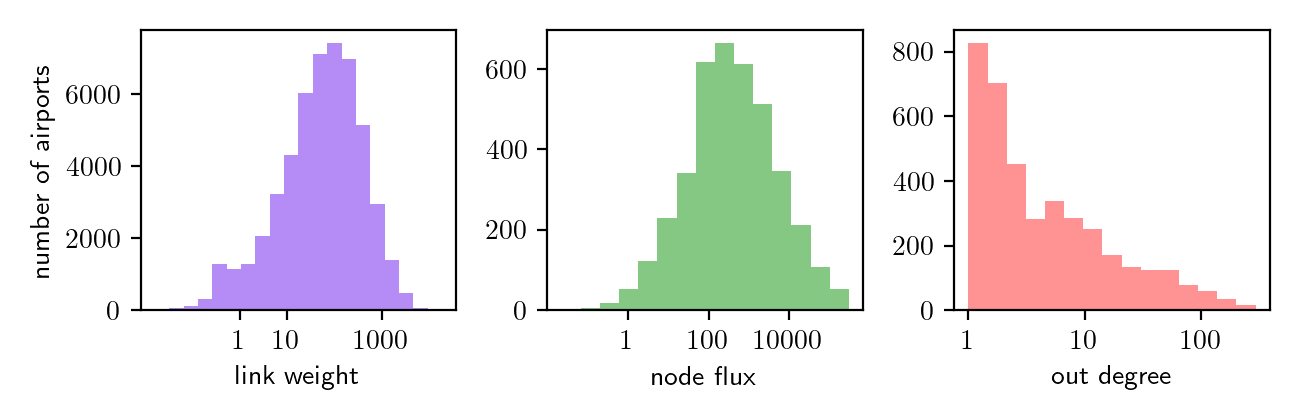
Statistics of the worldwide air transportation network. In the first panel of the figure above, the traffic flux betwwen nodes or average daily number of passengers traveling on flight routes between airports (link weight) can vary from less than 1 to over 1000. The second figure shows the number of passengers that traverse an airport on a daily basis (node flux), which does not exceed 100 in some airports, while others accomodate over 10000 people each day. Similarly, in the last panel, the number of flight connections emanating from an airport (out degree) is approx. 13 on average, though some airports boast over 100 direct connections.
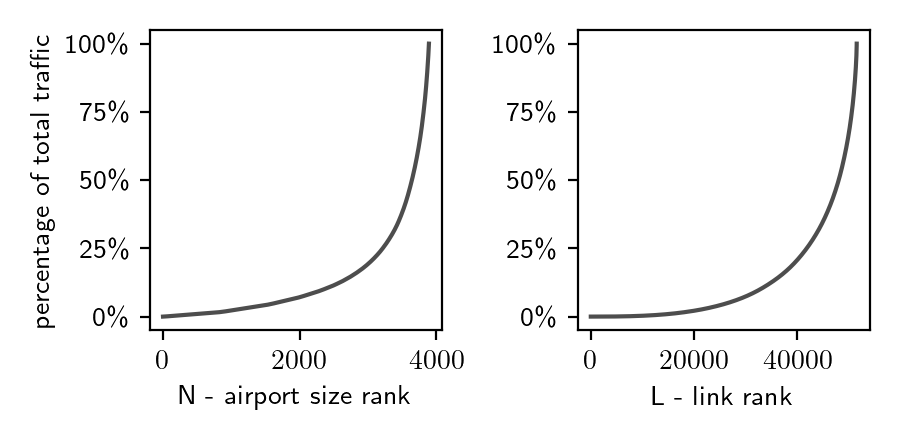
The WAN is dominated by big airports. As a result of the network heterogeneity of the WAN, the model is predominantly driven by only a small number of nodes, i.e. the big regional and international hub airports, while the majority of the nodes are structurally trivial. For example, if the smallest half of airports the network (approx. 2000) were removed, only about 7% of the total traffic would be lost.
Top 20 airports by traffic (excluding Mainland China)
| Airport Name | Code | Country | Continent | Link Weight |
|---|---|---|---|---|
| Frankfurt | FRA | Germany | Europe | 579 |
| Amsterdam | AMS | Netherlands | Europe | 551 |
| Paris Charles de Gaulle Apt | CDG | France | Europe | 546 |
| Moscow Domodedovo Apt | DME | Russian Federation | Europe | 502 |
| Istanbul | IST | Turkey | Asia | 485 |
| Atlanta | ATL | USA | Americas | 480 |
| Chicago O'Hare International Apt | ORD | USA | Americas | 474 |
| Munich | MUC | Germany | Europe | 455 |
| London Gatwick Apt | LGW | United Kingdom | Europe | 451 |
| Dubai | DXB | United Arab Emirates | Asia | 450 |
| Beijing Capital Intl Apt | PEK | China | Asia | 445 |
| Houston George Bush Intercontinental Ap | IAH | USA | Americas | 427 |
| Rome Fiumicino Apt | FCO | Italy | Europe | 419 |
| Dallas/Fort Worth | DFW | USA | Americas | 415 |
| Barcelona | BCN | Spain | Europe | 402 |
| Newark Liberty International Apt | EWR | USA | Americas | 391 |
| Denver | DEN | USA | Americas | 388 |
| Manchester | MAN | United Kingdom | Europe | 380 |
| Lester B Pearson Intl | YYZ | Canada | Americas | 373 |
| Brussels | BRU | Belgium | Europe | 367 |
Top 20 airports by degree (excluding Mainland China)
| Airport Name | Code | Country | Continent | Out degree |
|---|---|---|---|---|
| Frankfurt | FRA | Germany | Europe | 293 |
| Amsterdam | AMS | Netherlands | Europe | 278 |
| Paris Charles de Gaulle Apt | CDG | France | Europe | 275 |
| Moscow Domodedovo Apt | DME | Russian Federation | Europe | 251 |
| Istanbul | IST | Turkey | Asia | 242 |
| Atlanta | ATL | USA | Americas | 240 |
| Chicago O'Hare International Apt | ORD | USA | Americas | 238 |
| Munich | MUC | Germany | Europe | 229 |
| Dubai | DXB | United Arab Emirates | Asia | 228 |
| London Gatwick Apt | LGW | United Kingdom | Europe | 226 |
| Beijing Capital Intl Apt | PEK | China | Asia | 222 |
| Houston George Bush Intercontinental Ap | IAH | USA | Americas | 214 |
| Rome Fiumicino Apt | FCO | Italy | Europe | 212 |
| Dallas/Fort Worth | DFW | USA | Americas | 206 |
| Barcelona | BCN | Spain | Europe | 201 |
| Newark Liberty International Apt | EWR | USA | Americas | 195 |
| Denver | DEN | USA | Americas | 194 |
| Manchester | MAN | United Kingdom | Europe | 190 |
| Lester B Pearson Intl | YYZ | Canada | Americas | 187 |
| Brussels | BRU | Belgium | Europe | 187 |